6 Month Sales Update
It's been a bit under six months since I launched HelpSpot so I thought it was a good time to share some more sales data as I do from time to time. Overall I'm very happy with sales. They're well above what I expected for this point.
I'm especially encouraged since I've done pretty much no advertising or PR. I expect to be able to push sales a good percentage higher once I start to focus more on PR over the summer.
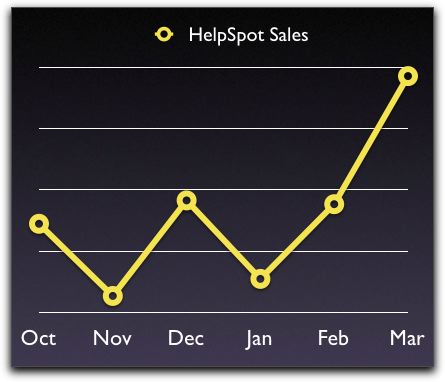
Below is the first 6 months charted out:

The points are in scale. I've left numbers off so they don't detract from the more interesting data. I've talked about some specific numbers before and I plan on doing so again when I hit a certain number I have in mind.
So let's go over each month. You'll see I started very nicely in October. That in fact is only the last week of October since HelpSpot launched on October 24th. That's the benefit of having a strong beta. You get a nice bump right up front.
In November there was a large dip which I expected. Most of the beta users had purchased that were going to purchase and I hadn't allowed new beta users near the end of the beta so there were no sales in the pipeline. November was mostly about getting new trial users.
December bumped back up as November trial users turned to customers.
I have nooo idea what happened in January. I assume that the slow down in trial users in late December due to the holidays led to the slow month.
In February sales went back up to the previous stable level around the same amount as October and December.
As you can see last month was a great month. Sales more than doubled over the previous monthly high. I'm not sure I can maintain that much momentum for this month, but it is lining up to be another good one.
Hopefully this was a bit informative. I know I couldn't find anyone sharing this information a few months back when I was looking. Nobody likes to show those down dips in their charts, but I think it's a great look at the way revenues roll when you're starting a small ISV.
Update:
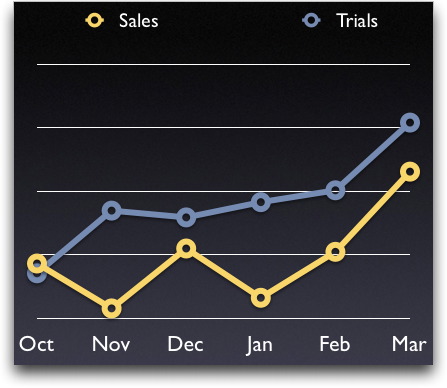
Jeff asked for a trials graph, so I've happily added that below. I've graphed them together so you can see the trend, obviously their scales are different.
